SnapAppy
PhD Research Study2018What is SnapAppy?
SnapAppy is a positive psychology intervention promoting positive thinking by integrating momentary smartphone photography with traditional intervention methodologies to improve emotional well-being.
What did the study involve?
Over a month-long study, participants were required to take photos and write about positive moments, past events, acts of kindness and gratuitous situations whilst also logging their mood and affect using established psychological measures.
How was the data analysed?
Data was extracted and processed with PHP and Python. LIWC was used to apply sentiment analysis to extract the positivity of the photo descriptions and the photos were fed into IBM Watson to perform object and colour recognition. R and SPSS were also utilised to analyse the data and generate outputs.
What did we conclude?
The results indicated that the number of photos taken, the effort applied to annotating the photos, the number of photos revisited and the photos containing people were positively correlated with an improvement in mood and affect.
The Tech
The front-end is built for Android and iOS using Cordova and the back-end is built on the LAMP stack.
SnapAppy was built as an SPA without a front-end framework due to upskilling time constraints, so I used Handlebars templates to replicate component reuse.
The application also worked offline by storing actions in a queue in local storage and pushing them to the server once the device came back online.
Onboarding
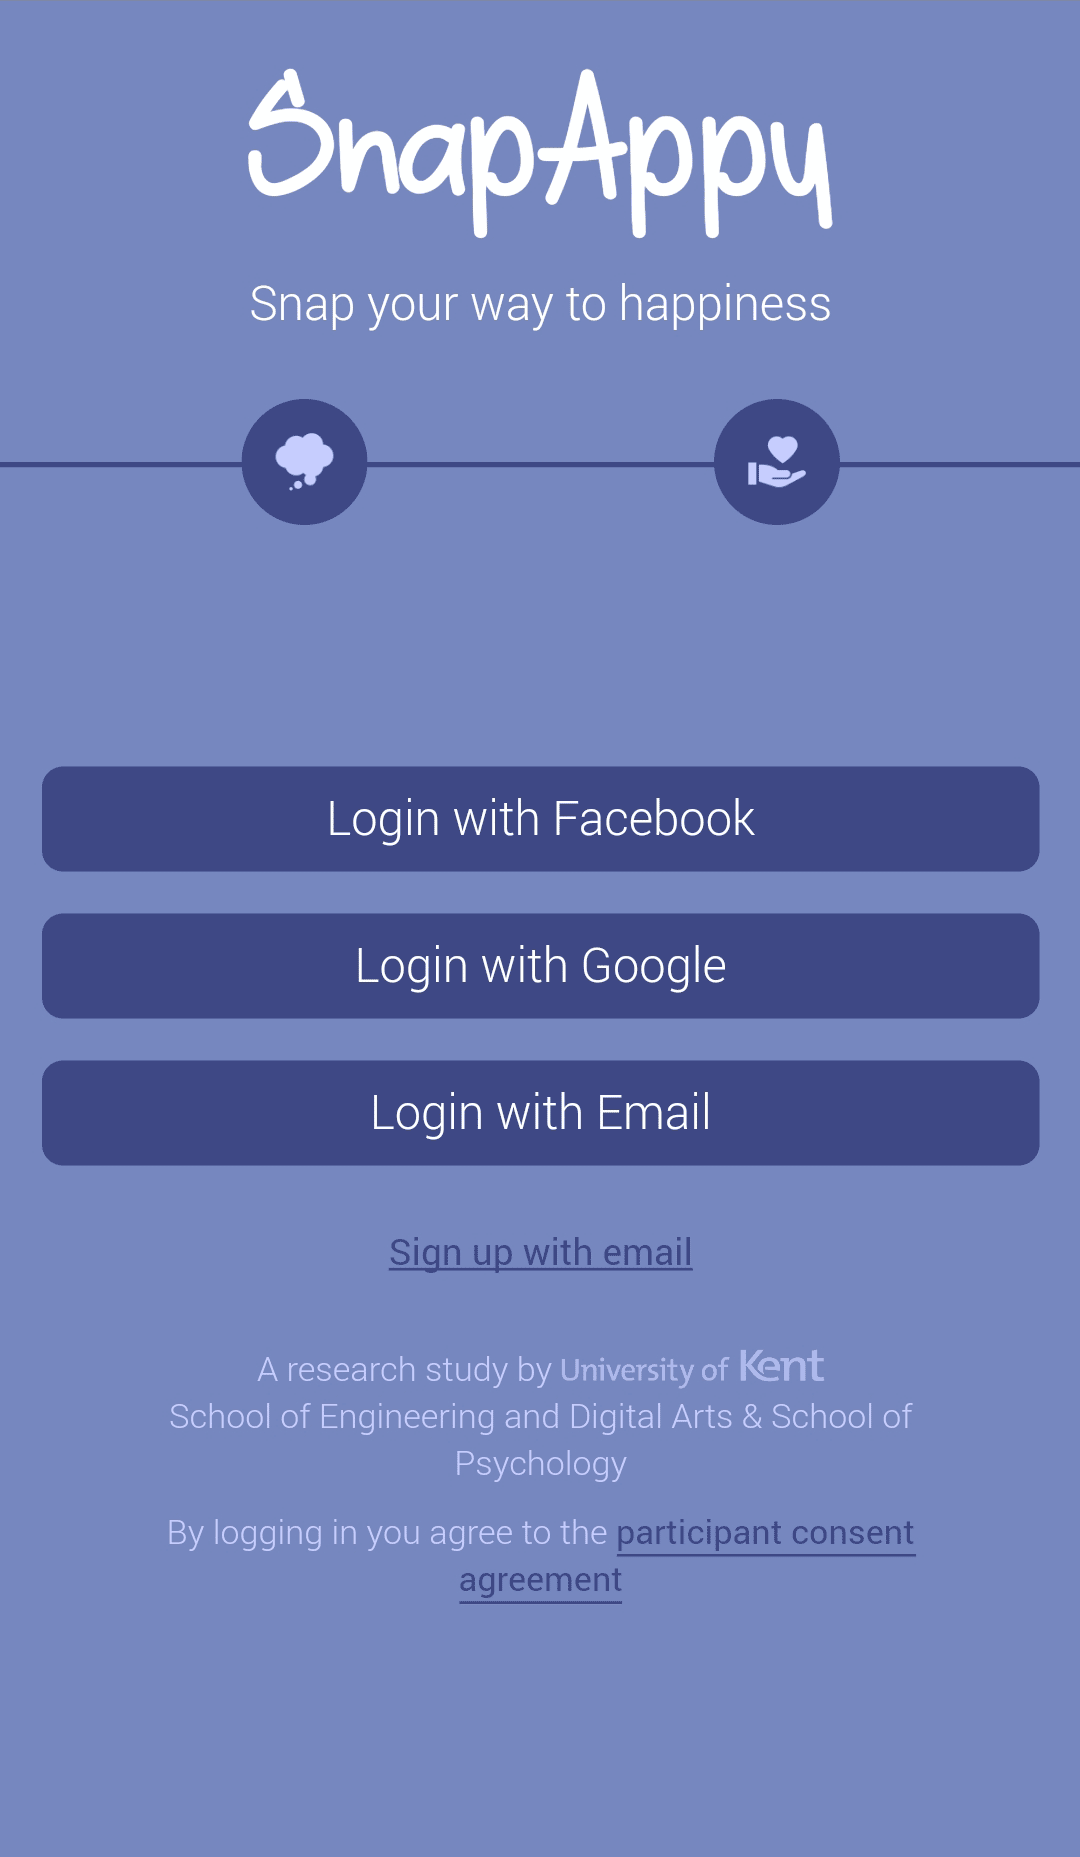
Participants can log in to the app using either Facebook, Google or an email and password.

During onboarding, participants are instructed to take or choose photos of positive moments.
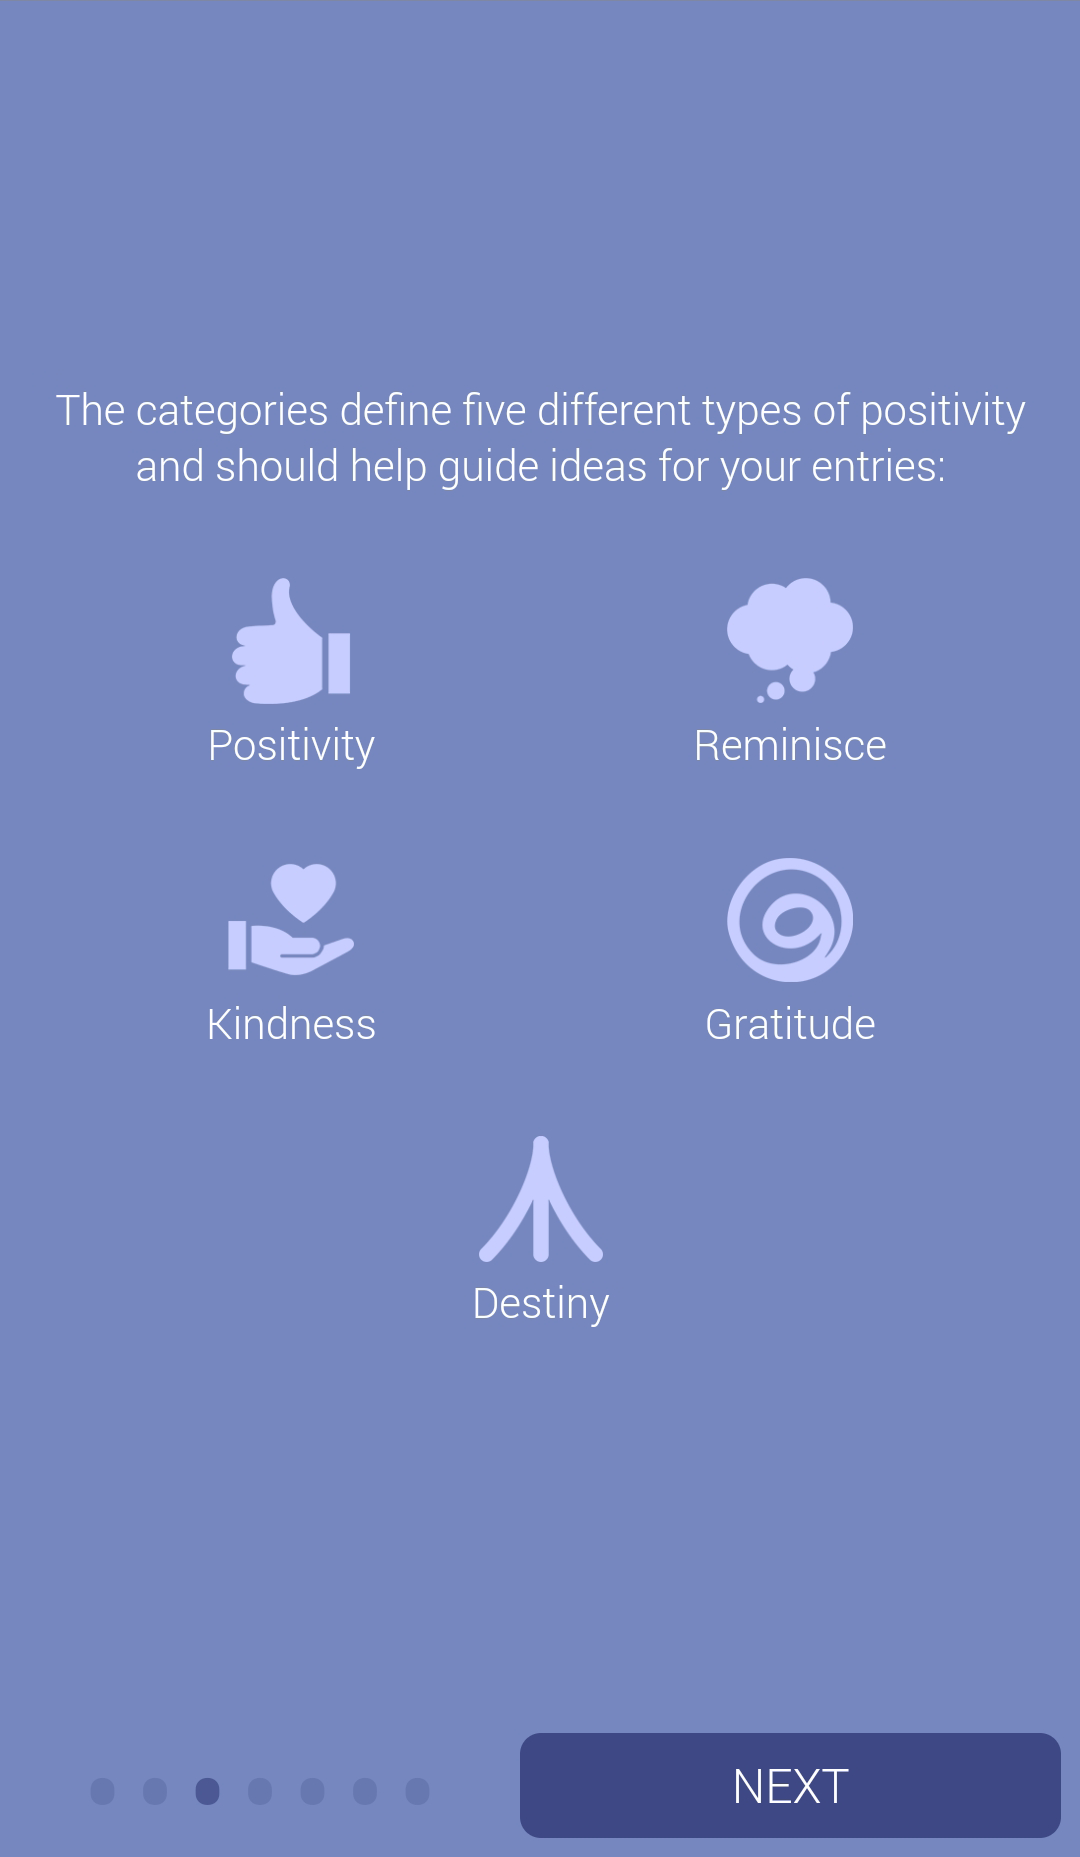
Participants are introduced to the five photo categories.
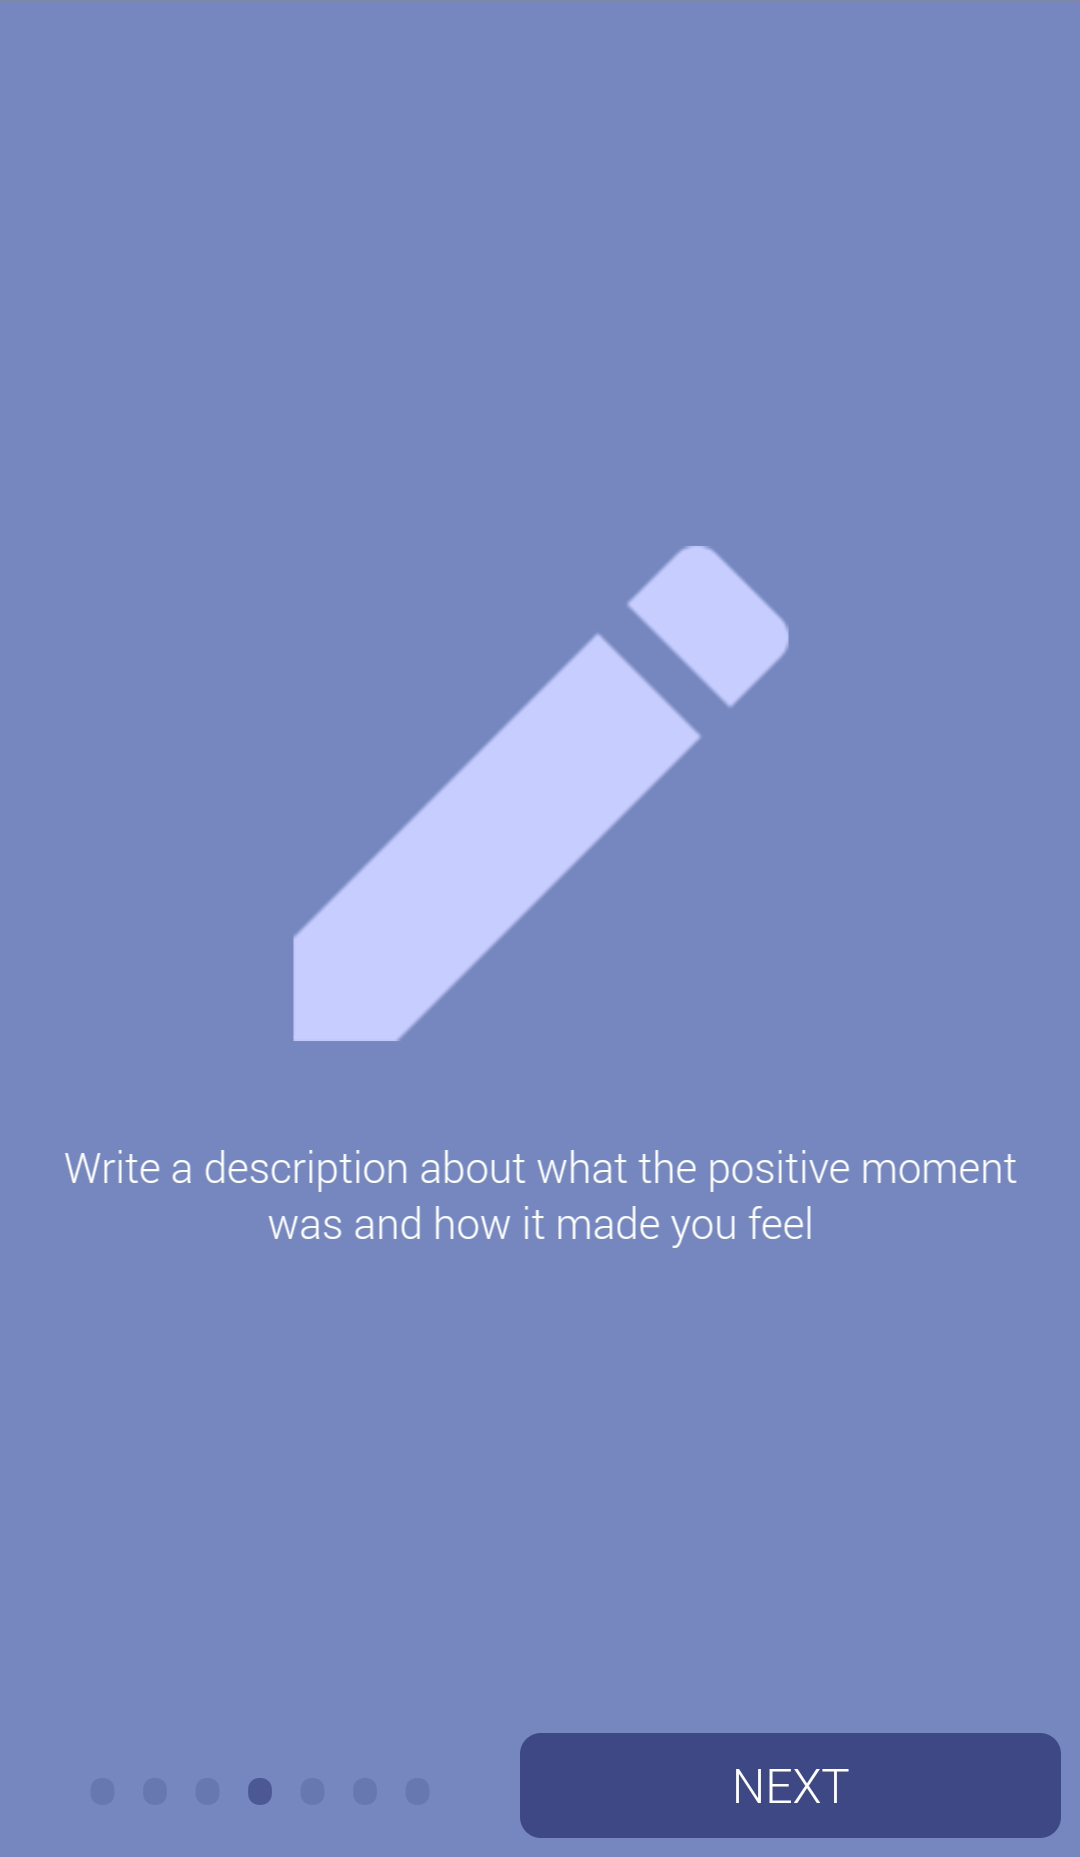
Participants are advised that they will need to annotate photos with an emotional description.

Finally, the participation instructions for the study are listed.
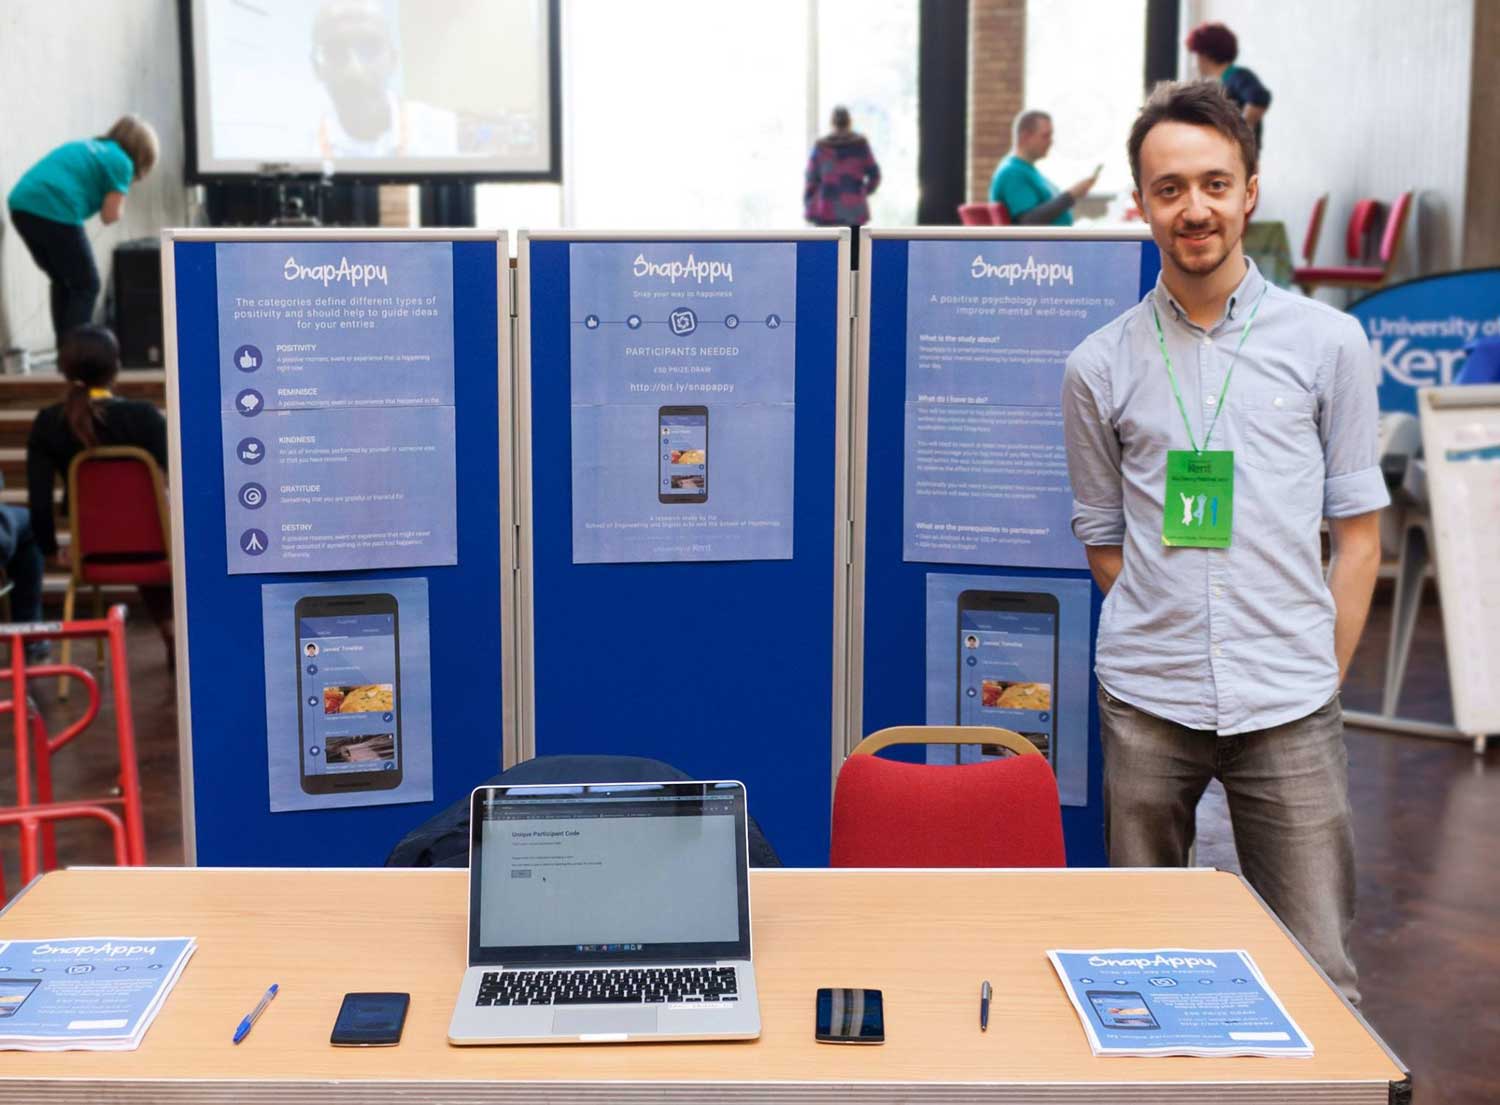
Promoting SnapAppy at the University of Kent Wellbeing Festival to attract study participants.
Logging Photos
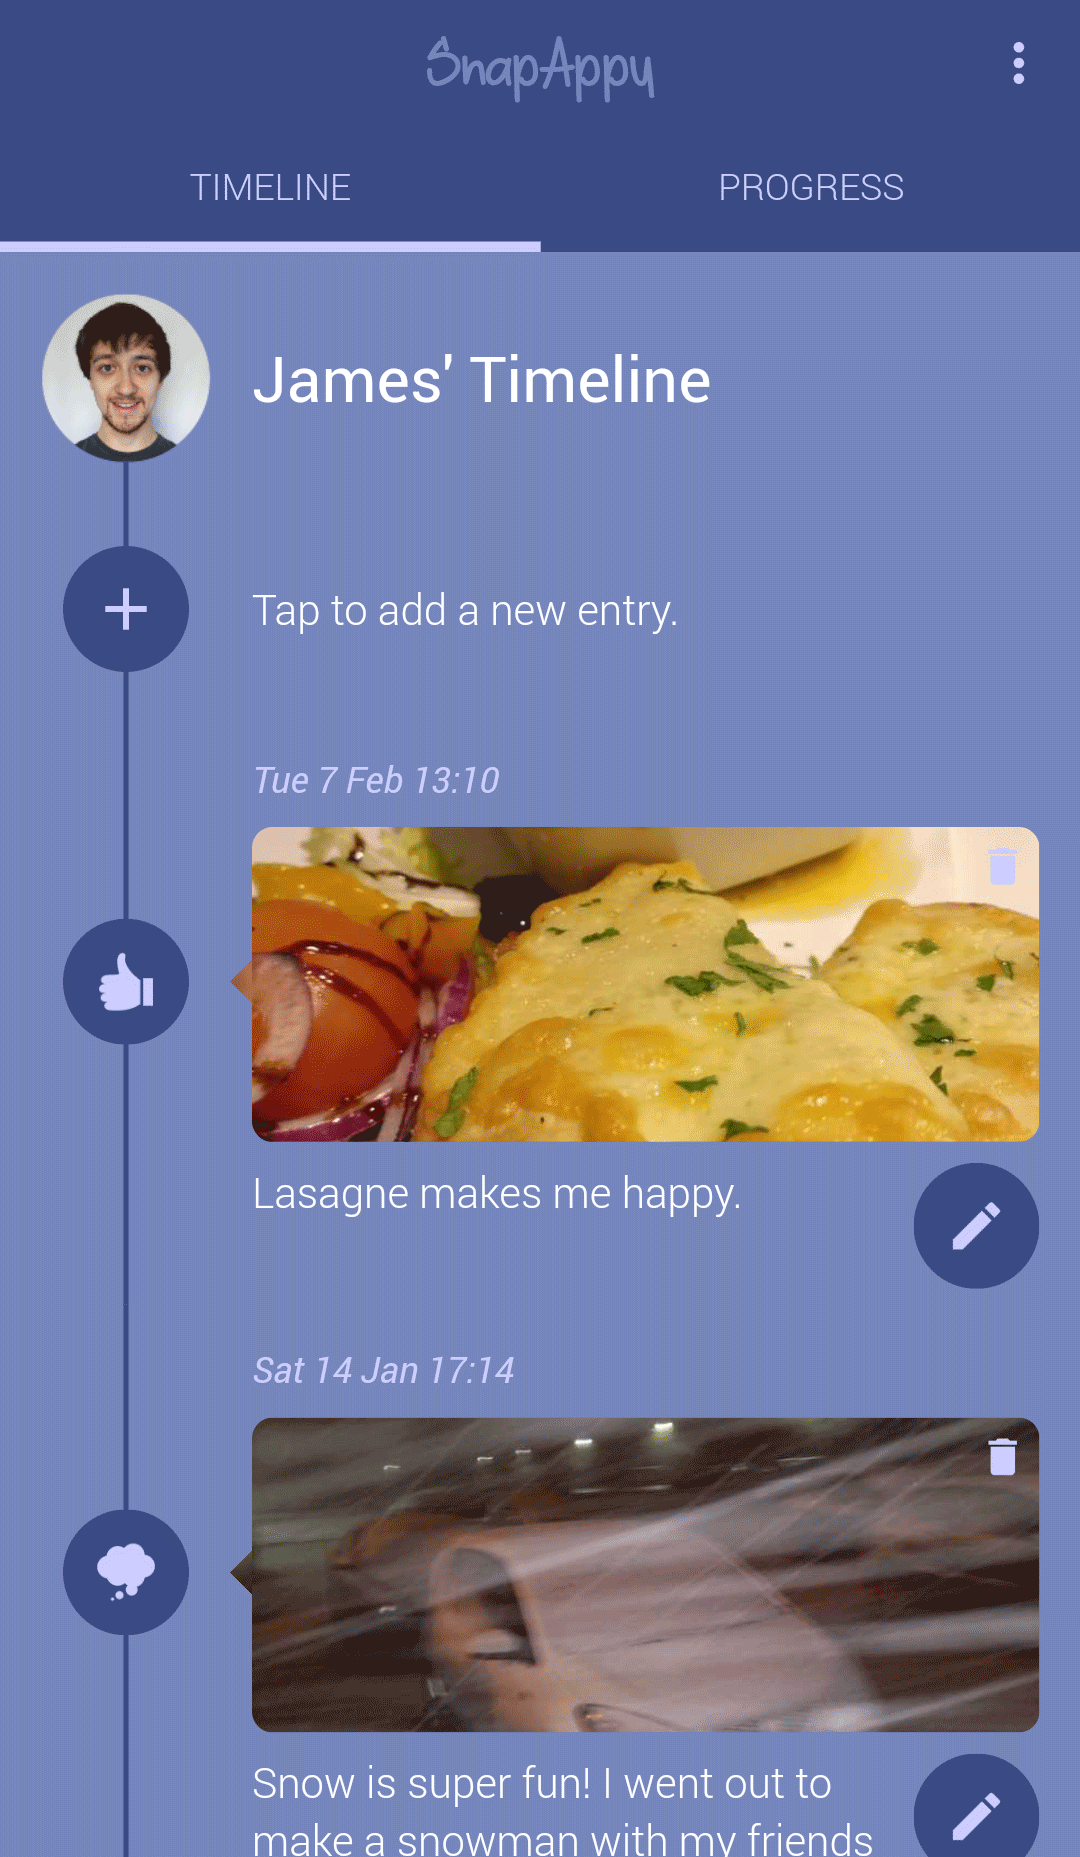
Entry photos, categories and descriptions can be viewed on the timeline screen.
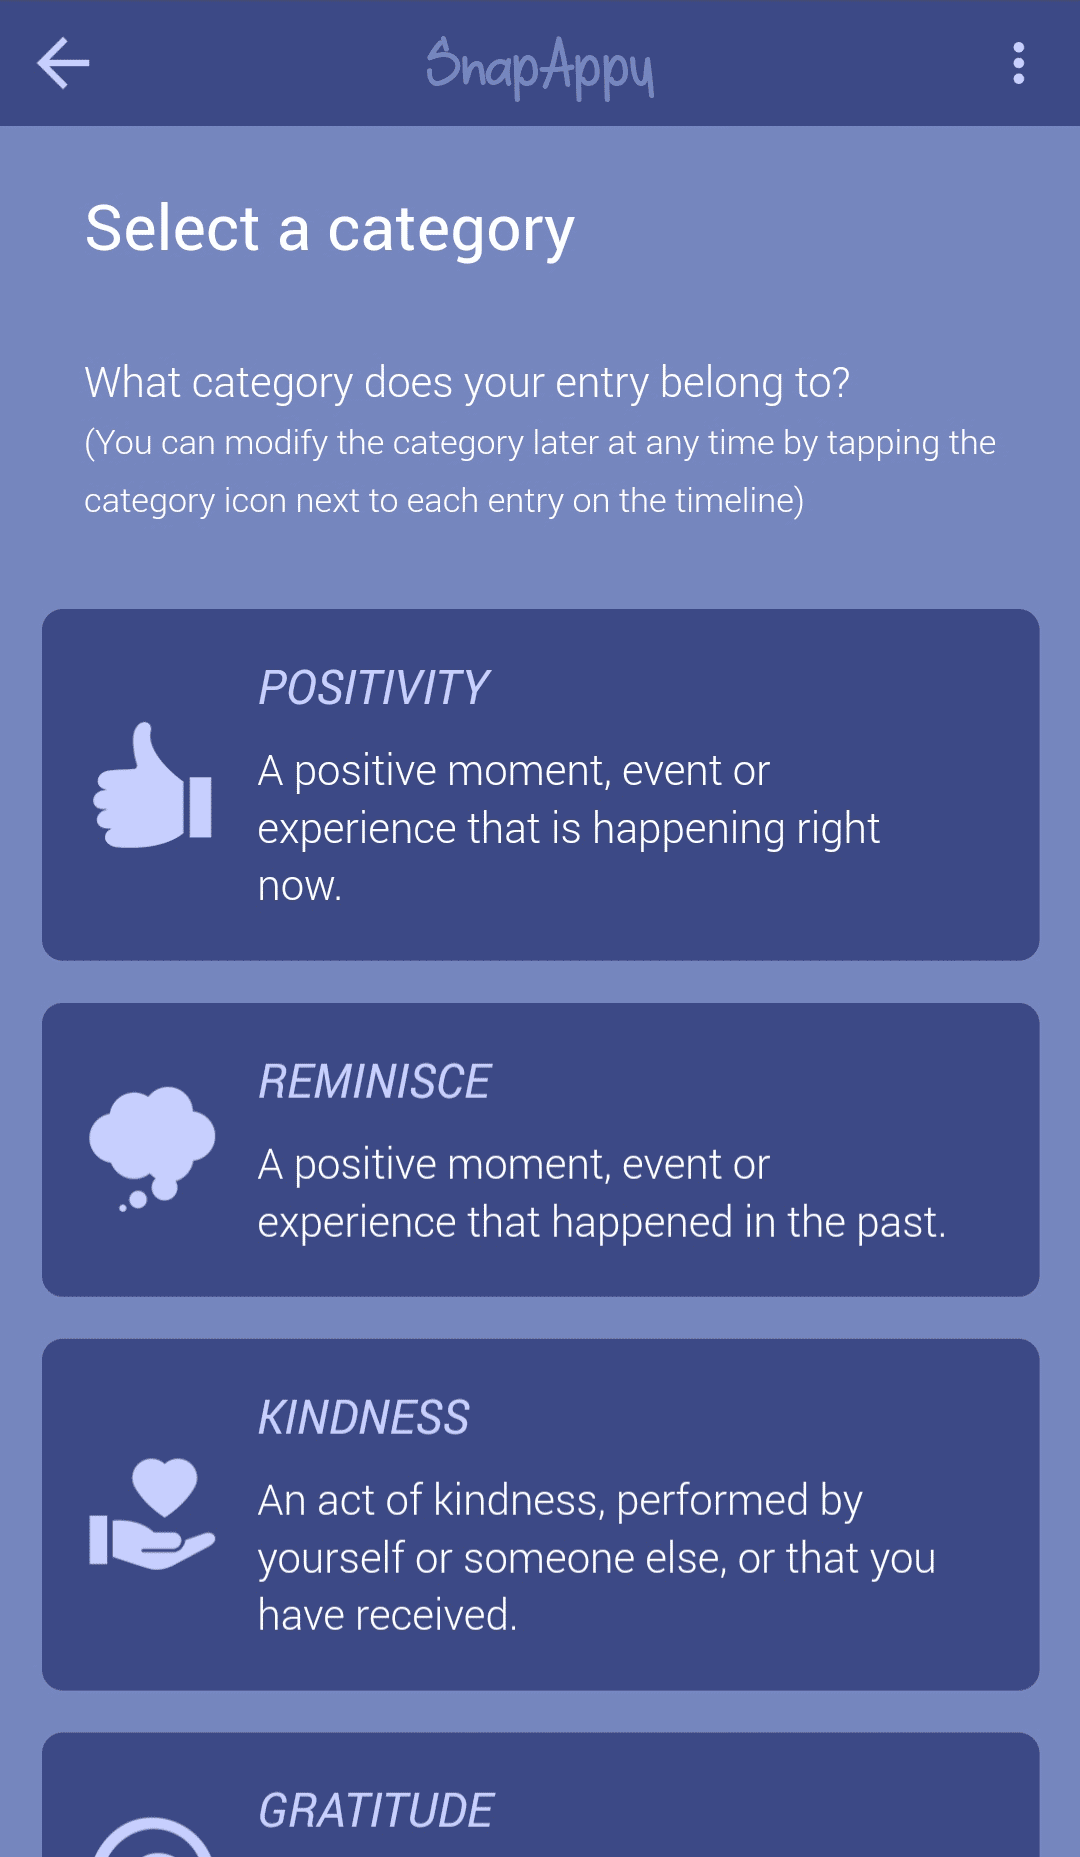
When taking a photo for a new entry, it must be assigned to a category corresponding to its type of positive experience.

After assigning the photo to a category, one can write a description describing how the event made them feel.
Study Progress & Surveys
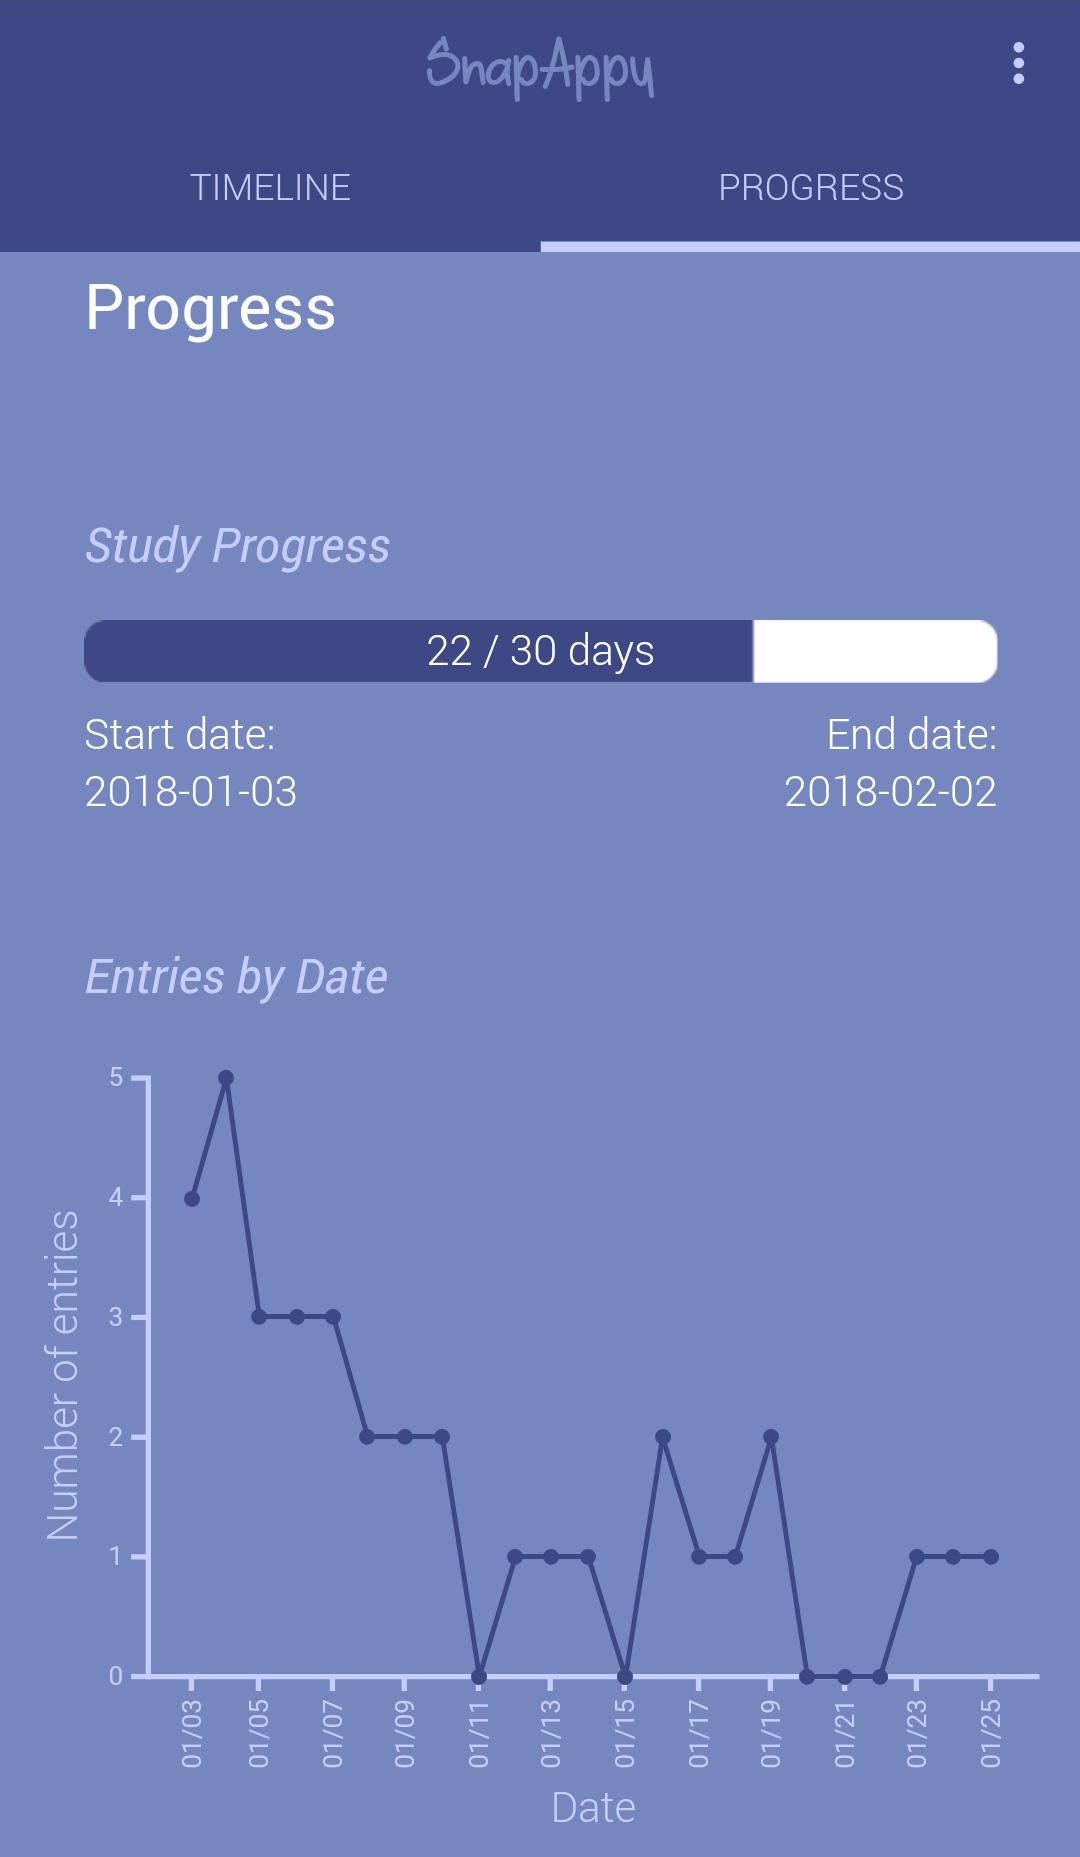
This screen shows the participant's progress through the study and the number of entries per day.
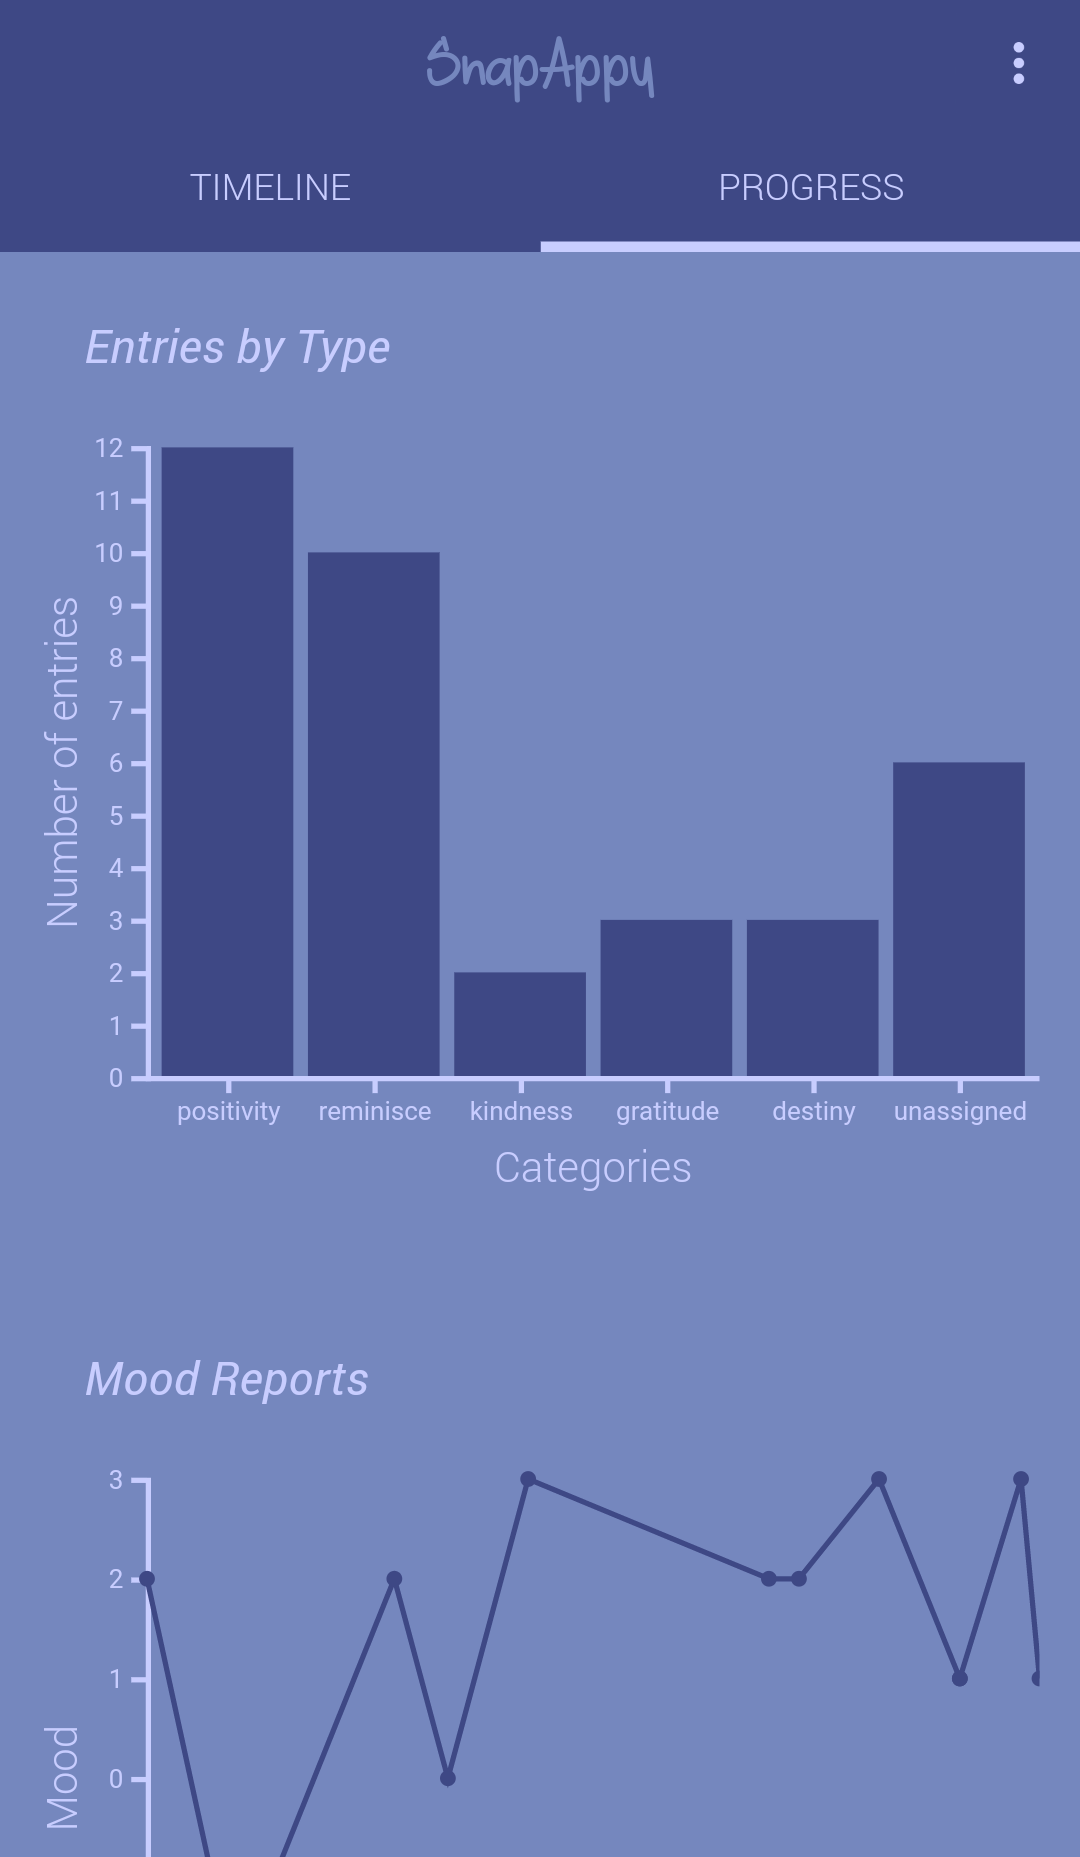
The progress screen also shows the number of entries per category and the participant's mood reports.

Participants could change the time of their mood notification in order to suit their sleep schedule.

Mood is reported using a 7-point Likert slider ranging from -3 (bad) to +3 (good).

The survey screen showing one affective state and the various answers from the PANAS survey.

Publications
The research findings from this study are published in Elsevier Pervasive and Mobile Computing Journal 2021.
Click here to read the full paper.
A study poster was presented at the EDA School Research Conference in 2018.
Click here to view the poster.
Credits
The logo was designed by James Rowe.